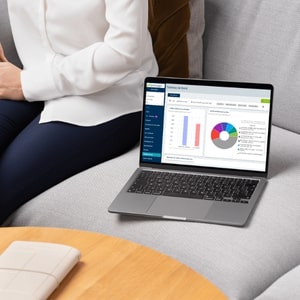
A successful salesperson isn’t one who spends the most time on the road – it’s one who knows where to go. The sales dashboard isn’t just a reporting tool – it’s your ally in making the right decisions in the field, at the right time. 💡
A well-thought-out dashboard lets you focus on the essentials: prospecting and customer relations?
Defining a sales dashboard
The sales dashboard is your daily ally in effectively managing your field sales activities. It's a tool that brings together your key indicators (sales, visits, prospects...) in the form of easy-to-understand graphs and tables.What is the purpose of a sales dashboard?
The sales dashboard meets several key objectives: tracking team performance, quickly identifying areas for improvement, and facilitating reporting to management.
Dashboards are simple, visual business management tools. It is generally made up of graphs (pie charts, histograms, line graphs) and tables.
To be truly relevant, a Dashboard must be based on the company’s needs. Based on an analysis of these needs, key indicators can be identified and then visually transcribed into the sales dashboard.

Essential business indicators to track
An effective Dashboard must integrate the KPIs most relevant to your business. Here are the main categories to consider:
| Target | Recommended KPIs |
|---|---|
| Increase sales revenue | – Monthly sales vs. target – Average order value |
| Develop prospecting | – Number of new contacts – Prospect/customer conversion rate – Number of qualified appointments |
| Improve productivity | – Number of visits / day – Time devoted to actual sales / day |
How to build a sales dashboard?
Creating an effective sales dashboard requires a methodical and thoughtful approach. Here’s a step-by-step guide to help you do just that.
1. Define your priority sales objectives
Before embarking on the creation of your Dashboards, take the time to clearly define your business objectives. Ask yourself the following questions:
- What are your short- and medium-term sales revenue targets?
- What are your priorities in terms of business development?
- What behaviors do you want to encourage in your team?
2. Select 5-7 really relevant KPIs
The key to effective Dashboards lies in the judicious choice of your indicators.
If you take an example of a commercial dashboard from the Internet, you’ll probably find it complex and ill-suited to the specifics of your business.
Avoid the “more is better” trap, especially if you’re a small business. Instead, focus on the KPIs that really reflect your objectives.
Resource: How do you define your sales indicators?
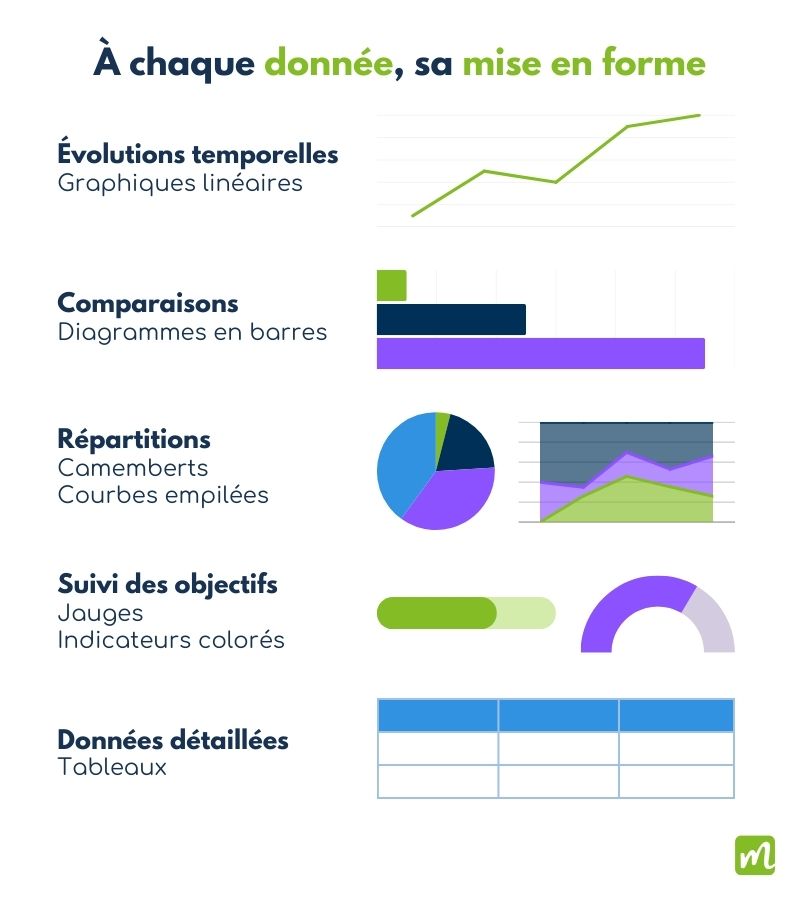
3. Choose the right visualizations
Each type of data deserves its own layout for optimum readability.
Here are the most relevant formats, depending on the type of information to be represented:

4. Determine update frequency
The frequency with which you update your Dashboards should correspond to your decision-making rhythm:
- Daily data: sales activity (visits, calls)
- Weekly data: sales pipeline, opportunities
- Monthly data: performance analysis, trends
5. Set up a reliable collection system
The greatest challenge facing sales directors is to collect reliable data on a regular basis. The relevance and effectiveness of your Dashboards depends on the feedback you receive from the field.
Standardize information entry
Set up mandatory fields and predefined drop-down lists for prospect status or appointment type. This not only saves you time, but also makes it easier to classify and filter your data.
Simplify field data entry
Equip your sales representatives with a tool that speeds up the entry of reports after each appointment, as well as the management of daily tasks. It’s an investment for the company, but a real time-saver when it comes to generating sales activity reports.
Trace exchanges and automate data collection
Take advantage of the key time-saving benefits of CRM: geolocation of visits, time-stamping of actions, real-time synchronization of data between field and office. These features enable you to collect a wide range of information automatically, with no extra effort on the part of your sales force.

How to create a dashboard with Moovago in 3 steps
- Create your session and import your data,
- Choose your dashboard template according to your objectives (Sales revenue or Business tracking),
- Customize your filters to suit your needs,
- Access your data in real time from any device.
Solutions for creating your sales dashboard
The choice of your Dashboards tool is crucial to ensuring its day-to-day effectiveness. Let’s take a look at the main options available, including the most obvious: excel dashboard VS CRM dashboard.
Excel: an accessible but limited solution
Microsoft Excel remains the most widely used tool for creating business Dashboards. It’s free, simple and flexible. However, this solution has several major drawbacks:
- You’re never safe from manual input errors (copy/paste mistakes, accidental deletions or modifications, etc.).
- You spend a lot of time updating your file,
- Impossible for several people to work on the same file at the same time,
- You have no guarantee that this file is safe (unless you store it on a protected server),
- Teams in the field may find it difficult to consult it on their smartphones while on the move.
CRM: the modern, automated solution
Compared to an Excel file, a CRM is a powerful alternative with many advantages.
22% of sales professionals cite reporting and data analysis as one of the main benefits of CRM (Hubspot, 2023).
Let’s compare the advantages and disadvantages of CRM and Excel for your Dashboards.
| Criteria | CRM (Moovago type) | Excel |
|---|---|---|
| Mobile use | ✓ Mobile/tablet application accessible everywhere ✓ Interface adapted to small screens ✓ Input possible even offline | ❌ Difficult to consult on mobile ❌ Risk of data loss ❌ Complex navigation on small screen |
| Typing time | ✓ Quick post-visit input ✓ Checkboxes and drop-down menus ✓ Voice dictation possible | ❌ Frequent double entry ❌ Risk of errors when copying and pasting ❌ Time wasted formatting |
| Data reliability | ✓ Centralized, synchronized data ✓ Change history ✓ No risk of corrupted files | ❌ Multiple versions circulating ❌ Formulas that can be broken ❌ Possible data loss |
| Team sharing | ✓ Real-time access for all ✓ Automatic notifications ✓ Data always up-to-date | ❌ Only one user at a time ❌ Manual email dispatches ❌ Risk of obsolete versions |
How often should I consult my Dashboards?
The sales dashboard is a strategic tool that deserves regular attention. But how often should you consult it to get the most out of it? The answer depends on your role and your objectives. Let’s discover together the best practices for each profile. 🎯
Consultation rhythms adapted to each profile
Let’s not forget that the dashboard must be a relevant and useful daily tool, not a hindrance to everyone’s key missions! Dashboards should be consulted according to individual needs:
| Profile | Recommended frequency | Key indicators |
|---|---|---|
| Field sales representatives | – Weekly for essential KPIs – Fortnightly for in-depth analysis | – Sales vs. targets – Number of visits – Transformation rate |
| Sales manager | – Daily for KPIs – Weekly for team monitoring – Monthly for detailed analysis | – Team performance – Sales by sales rep – Sales pipeline |
| Sales directors | – Bi-monthly for trends – Quarterly for strategic analysis | – Global trends – Performance by sector – ROI on actions |
It’s also worth noting that many companies see no point in giving their teams access to sales dashboards, preferring them to concentrate on their day-to-day missions rather than on analysis. This is quite understandable when you consider that only 33% of salespeople’s time is spent on active selling, according to CSO Insights figures.
Share best practices within the sales team
A dashboard is only effective if it becomes a real tool for the sales team. Its existence should be neither a secret nor a taboo.
To make it a lever for collective performance, introduce sales management methods based on exchange and communication:
- Organize short weekly reviews to analyze key indicators, and more in-depth monthly reviews to adjust strategy.
- Encourage successful salespeople to share their methods, and analyze successes and failures together to learn from them.
- Don’t forget to celebrate success: highlighting individual and collective performance, combined with motivating challenges, strengthens team spirit and general motivation.
With a CRM like Moovago, the manager has the right tool to steer his team effectively, while the teams benefit from other tools, better adapted to the concrete achievement of their objectives.
Dashboards thus become tools for collective progress, aligning the whole team towards common objectives.
FAQ : Your questions about Sales Dashboards
Dashboards are real-time management tools, while reporting is a more detailed, periodic analysis of sales activity.
Prioritize quality over quantity. 5 to 10 relevant indicators are generally enough for the sales management of a small business.
The indicators you need to include in your sales dashboards vary according to your organization and your objectives. The key is to select the indicators that reflect your priorities and enable effective management.
A sales CRM like Moovago lets you focus on key sales indicators. Focus on these 5 key KPIs:
- Visit transformation rate
- Number of visits / day
- Monthly sales vs. targets
- Customer loyalty rate
- Number of new qualified leads


