


Sales Reporting Software : Manage your business at a glance
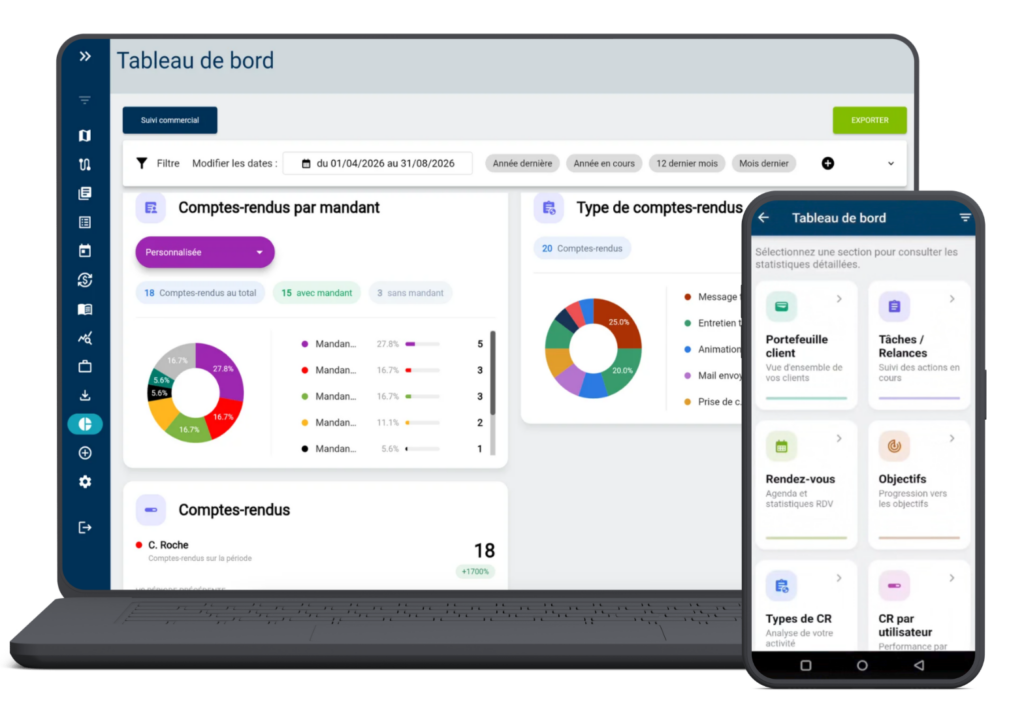
Track your sales activity directly from Moovago: tasks, follow-ups, appointments, reports, and changes in your customer portfolio. Data entered in the field is automatically fed into your dashboard.
Easily analyze your sales database
Manage your portfolio of clients and prospects
The Moovago dashboard lets you easily track the evolution of your database.
- Number of Companies: Track changes in the number of client and prospect companies in your database.
- Newly Established Companies: Determine the number of new companies added over a given period.
- Conversion Funnel: Visualize the journey of your companies from suspects to prospects to customers.
- Conversion Rate: Measure your team's ability to turn prospects into customers.
- Portfolio Allocation: Analyze the composition of your portfolio based on your own segmentation criteria.
Explore your data based on your own criteria
You have your own metrics and your own sales organization. That’s why Moovago lets you filter the dashboard data based on various criteria.
Go from a big-picture view to a detailed analysis in just a few clicks!

A clear view of your business activity with native sales reporting
All your sales data brought together in a single dashboard
You no longer need to compile or export the information entered by your sales representatives to generate your reports. Moovago automatically centralizes data from your sales activities and lets you track key metrics.
Tasks and Follow-ups
Track the number of tasks and follow-ups completed by each user.
Appointment
View the number of appointments completed during a given period.
Minutes
Analyze the activity recorded in Moovago and filter the reports by type.
Activity by Principal
For independent sales representatives, track the number of reports and appointments completed for each principal.
An individual or collective view of business activity
Managers and sales directors: Get a comprehensive overview of your team’s activities.
View the tasks, follow-ups, and appointments completed by each sales representative and analyze activity over the time period of your choice.
- Overview of the Team’s Activities
- Breakdown of Activity by Sales Representative
- Filters by user, by segment, by time period, by geographic region…
Everything you need to conduct your analyses!

Data accessible according to each person’s rights
Do you manage a team? Set each person’s permissions so that they can access only the data they’re authorized to see.
Managers can track their team’s activity, while sales representatives can view their own data without accessing their colleagues’ data.
Independent Sales Representatives: Track Your Activity by Principal

For independent sales representatives who work with multiple principals, Moovago makes it easy to distinguish between the work done for each one.
Take a look at the following:
- the number of appointments per principal;
- the number of reports per principal;
- the activity carried out over a given period;
- the types of reports generated for each principal.
Sales reporting tailored to your organization, without creating a multitude of Excel files.
Data automatically updated in your sales reports
Your reports are generated automatically: your sales representatives enter their appointments, tasks, follow-ups, and reports into Moovago. This information is fed directly into your dashboard.
This gives you a up-to-date view of sales activity without requiring your teams to fill out additional reports.
No duplicate entries
The data comes directly from Moovago’s day-to-day fieldwork
No manual compilation
You no longer need to collect information from each sales representative and consolidate it to create a dashboard.
Information available at any time
Managers and sales representatives can view the metrics corresponding to their access rights, which are updated in real time.
The field reporting software that adds value to the work of field sales representatives
Salaried sales representatives
- Use Moovago on a daily basis to enter your reports, create your prospect and customer files, make your rounds or record your sales.
- Your reporting feeds on your actions automatically.
- Your manager can access your report without you having to send it.
- 0 minutes spent on reporting
Manager, sales manager or sales director
- Open Moovago and find all your field data in a simple, concise dashboard.
- Real-time field data.
- Essential filters + custom segmentation filters.
- Unlimited exports to Excel.
- 0 minutes spent on data collection and report preparation.
Sales agency account manager
- Your field sales representatives use Moovago every day for sales follow-up and to notify you of their sales.
- Your tracking table is updated in real time.
- Show the customer the value of the sales team's work.
- 0 minutes spent on data collection and report preparation.
Manage your business using reliable sales reports
With Moovago, your sales data automatically feeds into a simple, actionable dashboard that you can use every day. Want to try out our dashboards? Try Moovago free for 15 days and discover the potential of our reporting and monitoring tools.
You can also schedule a free demo with an advisor to help guide you through the process!

Frequently Asked Questions About the Sales Follow-Up Dashboard in Moovago
What is sales reporting and why is it so important?
Sales reporting consists of gathering, analyzing and presenting sales and activity data in order to make informed decisions.
It’s essential, because it provides a clear view of the performance of each salesperson and each sector, and enables opportunities or areas for improvement to be identified quickly.
With reliable, up-to-date information, managers can adjust strategy, motivate teams and maximize sales revenue.
How do I create a sales reporting table?
Moovago’s reporting dashboards are ready to use, giving you a comprehensive view of your business. The metrics update automatically as field sales representatives complete their work. Managers, meanwhile, can view data updates in real time.
If required, you can easily extract your data in just a few clicks, and share it with other stakeholders (managers, suppliers, principals, etc.) who are not yet using Moovago.
What can you track using the sales follow-up dashboard?
The sales follow-up dashboard allows you to track tasks, follow-ups, appointments, and reports created in Moovago, as well as various metrics related to your sales database.
Can we track each sales representative's activity?
Yes. Managers can view their team members’ activity and filter the data by user and time period, depending on their access rights.
Can sales representatives view their colleagues' data?
Access to data is managed based on the permissions assigned to each user. This allows a sales representative to access their own data without necessarily having access to that of other team members.
Can we track activity by principal?
Yes. Independent sales representatives can, among other things, track the number of appointments and reports completed for each of their principals.
Can we filter the reports?
Yes. In particular, the data can be analyzed by report type and various criteria available in Moovago.
Does the dashboard allow you to track prospects and customers?
Yes. In particular, it allows you to track changes in the database, newly created companies, the “suspect” > “prospect” > “customer” funnels, the conversion rate, and the portfolio breakdown according to your segmentation criteria.
Is the dashboard included in the Moovago plans?
The sales follow-up dashboard is included in all Moovago plans, starting with the first plan. Additional dashboards are also available as an option or as part of the Enterprise plan: Learn more
Which format should you choose for your sales reports (Excel, PDF, etc.)?
Moovago’s integrated Dashboards are an excellent way to visualize your data in the form of graphs and summary tables.
However, some companies prefer to continue the analysis in a spreadsheet to perform specific sorting or further manipulation. In this case, you can export your reports in Microsoft Excel format and, if required, transform these files into PDF for easy sharing.
What's the right frequency for sales reporting?
It all depends on your organization and your objectives: a daily follow-up allows you to react very quickly, while a weekly or monthly review gives you more distance to analyze trends.
Some teams also set up a more detailed annual report to plan their long-term strategy. With Moovago, tracking charts are accessible to all authorized persons at all times, giving you the freedom to view and share your results as and when you need to.
Check out the other dashboards available in Moovago

Dashboard: Goal Tracking
View the results of your sales activity and gain access to the metrics you need to manage your business or team.
Included in the Business Plan / Available as an option

Dashboards
Sales revenue
Analyze your sales overall and by customer, instantly spot new opportunities and consolidate your sales forecasts.
Included in the Sales Revenue Tracking option