As a field sales representative, you know that tracking your performance isn’t just a question of sales revenue. To really improve your sales reporting as well as your sales steering, you need torely on the right sales indicators. 🎯
Here are the 5 most important sales KPIs in our opinion: the ones you absolutely must monitor to effectively manage your business.
Why track your sales indicators when you're a field sales representative?
What is a sales indicator?
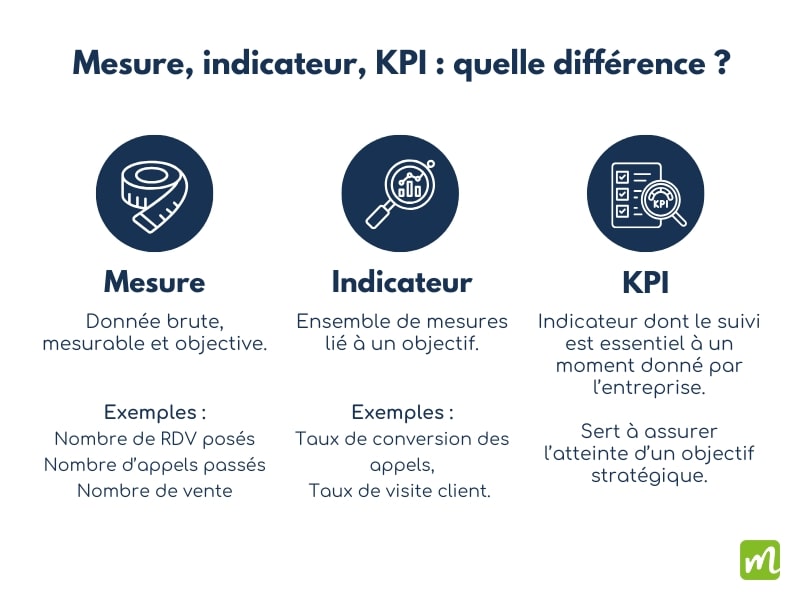
A sales indicator is a set of measures used toassess the performance of a business activity.
To support its development, a company often selects a few indicators that will be essential to monitor at a given time. These are known as KPIs(Key Performance Indicators).

The importance of sales indicators in sales strategy
Sales indicators are not just numbers, but real performance drivers. Tracking their evolution over time will enable you to:
- Measure theeffectiveness of your salesactions,
- Quickly identify areas for improvement,
- Make the right decisions to achieve your goals,
- Demonstrate the value of your actions to your management.
The 5 essential sales indicators
A company’s choice of sales indicators is very often linked to the specifics of its sales methods and objectives. For example, field sales representatives often face similar challenges, and so choose to track the same data.
Here are the 5 sales KPIs that, according to our expertise, really make the difference on a daily basis.
1. Sales revenue
Sales revenue is one of the most obvious sales indicators. Most companies have sales targets, so they need to generate sales revenue to be profitable.
There are several ways to approach sales analysis:
- Sales revenue generated over a given period,
- The sales revenue generated by each salesperson over a given period (or the percentage of their contribution to total sales),
- Sales revenue invoiced per customer or per store (or the percentage of each customer’s sales in total sales).
2. Sales growth rate
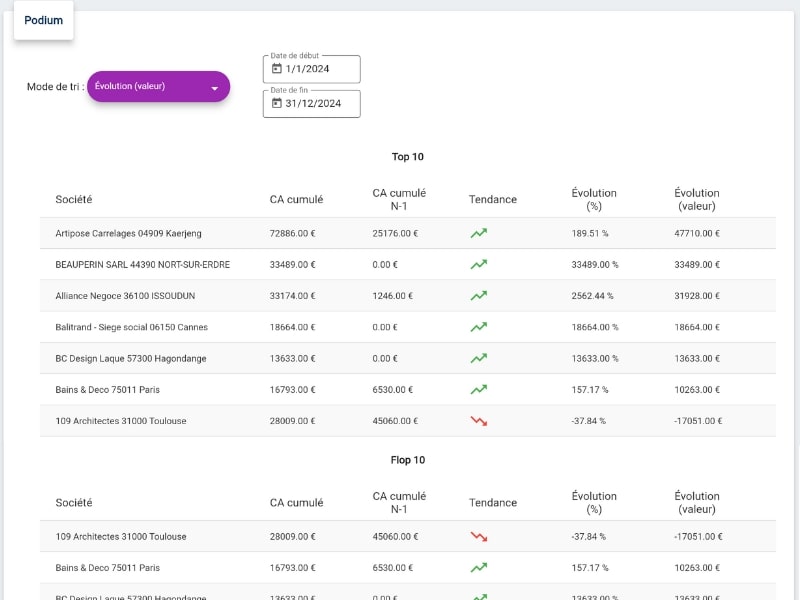
In addition to sales revenue in absolute terms, analysis of percentage changes is crucial to effective management of your business. It enables you not only to detect global trends, but also to analyze the health of each customer account.
For example, a customer whose sales have fallen by 15% over the last 6 months deserves special attention, even if he remains in your top 10. Conversely, a B customer with +30% growth could become a strategic A customer.
Here are some ideas for interesting measures to monitor:
- changes in overall sales revenue from year to year,
- salesrevenue per customer account compared with the previous year,
- changes in the number of sales.
This comparative analysis enables you to quickly identify deviations from your sales revenue forecast, and adjust your sales action plan accordingly. You’ll be able to schedule courtesy visits to customers who are losing power, or boost your prospecting to compensate for a significant loss of sales.

3. Customer visit rate
What is the customer visit rate?
A true compass for your sales activity, the customer visit rate represents the percentage of visits honored in relation to planned visits over a given period.
For example, if you planned to see 10 customers today, but were only able to achieve 8, your visit rate is 80%.
What is the customer visit rate formula?
The visit rate is simply calculated :
Visit rate = (number of visits made / number of visits planned) × 100
Optimize your visit rate by planning your rounds efficiently
- Plan your visits in advance,
- Confirm your appointments the day before, if possible,
- Check the feasibility of your rounds in advance with a sales round planning tool.
4. Transformation rate
The conversion rate is one of the most widely used performance indicators, both in sales and marketing.
The conversion rate represents the percentage of contacts who carry out a desired action. This action could be accepting an appointment or making a purchase.
How to calculate the conversion rate? The transformation rate formula
To calculate your conversion rates (yes, there are several), you first need to determine what you want to measure.
If you want to evaluate the performance of your cold calling or prospecting methods, you can calculate the call transformation rate:
Call transformation rate = (number of appointments booked / number of prospects called) × 100.
In the same way, you can also calculate the appointment conversion rate, which highlights the number of visits leading to a sale. One of the most important sales indicators for any good field sales representative!
The calculation formula for this conversion rate is as follows:
Appointment conversion rate = (number of sales / number of visits) × 100.
Finally, your company’s conversion rate will give you an idea of the effectiveness of your sales approach as a whole. It represents the total number of sales or contracts signed in relation to the total number of prospects in the sales pipeline. In short, your conversion from prospect to customer.
Then apply this formula:
Overall conversion rate = (number of sales / total number of leads) × 100.
Or its variant to compare the results of your different salespeople:
Salesperson conversion rate = (number of sales made by this salesperson / total number of prospects followed up by this salesperson) × 100.
What is a good conversion rate?
On average, the conversion rate for cold calling is 2% for B2B companies. The average overall conversion rate for a company is 20%.How can you optimize your conversion rate?
The conversion rate is one of the most revealing indicators of your sales performance.
To improve it, start by analyzing your successes in detail: Which arguments hit the mark? What objections did you overcome? This analysis will enable you to identify the winning practices you need to replicate.
A mobile CRM is your best ally in this process. By centralizing the history of your customer exchanges, it will help you better understand the path that leads to a signature. You can then fine-tune your approach according to feedback from the field and the specific characteristics of each customer.
5. Customer visit frequency
Visit frequency is an indicator that measures the regularity with which a sales representative visits customers.
In concrete terms, it measures the time elapsing between two visits to the same customer (for example, one visit every 30 days).

What is the ideal frequency of customer visits?
It’s hard to give an ideal standard or frequency, since it can vary enormously depending on your sales organization.
It will depend both on the number of field sales representatives and the average length of your appointments, but also on the size of the sales zones (i.e. the distance between customers).
How can you optimize your customer visit frequency?
Too far apart, and you risk weakening your ties with your customers. Too close together, and it can become counter-productive and time-consuming.
The challenge is to find the right balance for each customer. 🎯
- Determine two or three visit frequencies based on your resources and the size of each sales rep’s portfolio (week, fortnight, month, quarter, etc.).
- Segment your customer base according to individual needs.
- Simplify your sales force’s administrative tasks to give them more time to visit their customers.
- Equip your field sales representatives with a mobile CRM or round planning tool to enable them to bounce back effectively in the event of cancelled appointments.
Do you work in retail? Don't forget your retail KPIs!
The retail sector has its own performance indicators, essential for measuring the effectiveness of in-store presence and optimizing product distribution :
- Digital distribution (DN),
- Value distribution (DV),
- The cover,
- The linear share,
- Etc.
How can you effectively measure these sales performance indicators?
Sales management depends on the quality and reliability of your indicators. To guarantee their relevance and maximize their usefulness, here are the three fundamental pillars you need to put in place.
Digitalize your prospecting and customer care
Scattered data is the first obstacle to effective sales follow-up. Between Excel files, handwritten notes and information stored on different devices, it quickly becomes impossible to get a clear, reliable view of your business.
The solution? Opt for a mobile CRM that allows you to :
- Consolidate all business information in one place
- Access data from any device
- Automatically secure information
- Standardize data entry to facilitate analysis
Regularity is key
The quality of your sales indicators depends on the regular and accurate collection of field data. For your sales force, between customer meetings and prospecting, this task must not become time-consuming or be perceived as an administrative burden.
The solution is toequip your teams with a monitoring tool adapted to the field.
Your winning routine with Moovago
- Consult your daily objectives in the Sales News,
- Organize an optimized sales round in just a few clicks,
- Take one minute (top chrono) at the end of each appointment to create a report and future tasks,
- Take advantage of the break between appointments to make your calls and follow-ups.
Training, support, progress
Implementing tools and processes is not enough to guarantee effective monitoring of sales metrics.
Beyond the technical aspects, success depends on the commitment of your teams. Your sales teams need to understand the practical use of these indicators in their day-to-day work, and master the best practices for data entry.
- Start by communicating your objectives and indicators to your teams.
- Then support each salesperson in getting to grips with their work tools, showing how to easily integrate data entry into their daily routine.
- Promote and share best practices at team meetings.
Setting up simple, effective dashboards
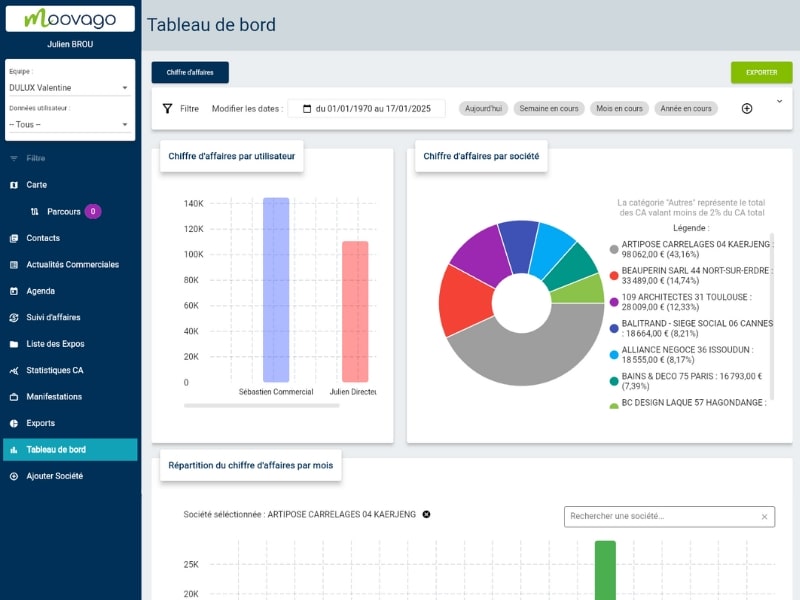
To give concrete form to this follow-up, a sales dashboard is essential. It provides a simple, visual way of tracking key sales indicators.
Managers and sales directors consult it regularly to quickly identify trends, spot deviations from targets and make the right decisions.
In short, the dashboard is the central point of your sales management!

The secret of good sales management? The effective sales dashboard
Discover Moovago's simple dashboard template. Everything has been thought out to save you as much time as possible:- A ready-to-use dashboard with the most important sales indicators,
- Easy-to-analyze graphs, diagrams and tables,
- Fed by your Excel imports and real-time field data.
FAQs on essential B2B sales indicators
Sales KPIs must reflect the specificities of your business sector. While some indicators are universal for field sales representatives (sales revenue, conversion rate, visit rate and frequency), others depend on your context:
- KPIs adapted to the retail sector,
- KPIs adapted to cold calling and phoning,
- KPIs adapted to your sales pipeline (e.g. conversion from stage to stage, sales forecast, etc.).
To identify your relevant KPIs, use the SMART method. Define indicators that are specificto your business, measurableusing your own tools (like Moovago), achievableto maintain motivation, realisticwith your current resources, and temporallydefined for effective follow-up.
The frequency with which you monitor your sales indicators must be adapted to your sales cycle. Daily monitoring is essential for operational metrics such as the number of visits made or tasks to be completed. On a weekly basis, analyze your transformation rate and the evolution of your sales pipeline. Monthly monitoring is essential for sales revenue and underlying trends.
With Moovago, you can automate this multi-level monitoring. Dashboards give you an instant overview of your daily activity, while weekly and monthly reports help you identify trends and adjust your sales strategy. This organization avoids information overload, while maintaining optimum responsiveness to opportunities and alerts.
Involving your team in KPI monitoring rests on three essential pillars. First, give meaning to the indicators by demonstrating their concrete usefulness: optimizing rounds, improving conversion rates, identifying best practices.
Then, simplify data entry: with Moovago, your sales reps can enter their visits in just a few clicks on their smartphone, without wasting any time. Finally, create a collective dynamic by regularly analyzing results as a team, and rewarding the successes of each individual. Performance then becomes a shared project.
For field sales representatives, the 5 key KPIs are sales revenue, visit rate, conversion rate(s) and customer visit frequency.
KPI stands for Key Performance Indicator . It is an indicator considered essential by a company to achieve its strategic objectives.
In the commercial world, these indicators are measurement tools that enable you to assess the effectiveness of your actions and the achievement of your objectives at a given point in time.
